If you’ve been trading forex long enough, you’ve probably noticed how price sometimes forms familiar shapes, such as triangles, wedges, double tops, and head and shoulders. These aren’t random drawings; they’re Market Structure Patterns, and they carry a lot of weight in technical analysis. The problem? Spotting them in real time can be tough, especially if you’re monitoring multiple pairs.
That’s where the Market Structure Patterns Forex Indicator for MT4 comes in. This tool automatically scans your charts, identifies patterns, and shades them clearly so you never miss a key reversal or continuation setup.
Why Market Structure Patterns Matter in Forex Trading
Market Structure Patterns are the Price action left by buyers and sellers as they engage in a battle for dominance. Over time, traders realized that certain formations tend to lead to predictable outcomes. For example:
- Triple Bottom near support → bullish reversal
- Triangle in an uptrend → bullish continuation
- Head and Shoulders → bearish reversal
These aren’t just textbook theories. They’ve been back-tested across decades of market data and continue to be used by professional traders and institutions alike.
The Market Structure Patterns Indicator simplifies the process by automatically recognizing these shapes, eliminating the need for hours of manual drawing and verification.
How the Market Structure Patterns Indicator Works
Once added to your MT4 chart, the indicator always scans price action and highlights formations:
- Reversal patterns like double tops/bottoms, head and shoulders
- Continuation patterns like wedges, flags, and triangles
- Exhaustion patterns signaling a possible shift in trend
Each detected pattern is labeled and shaded on the chart, giving you a clear visual of what’s happening.
Example:
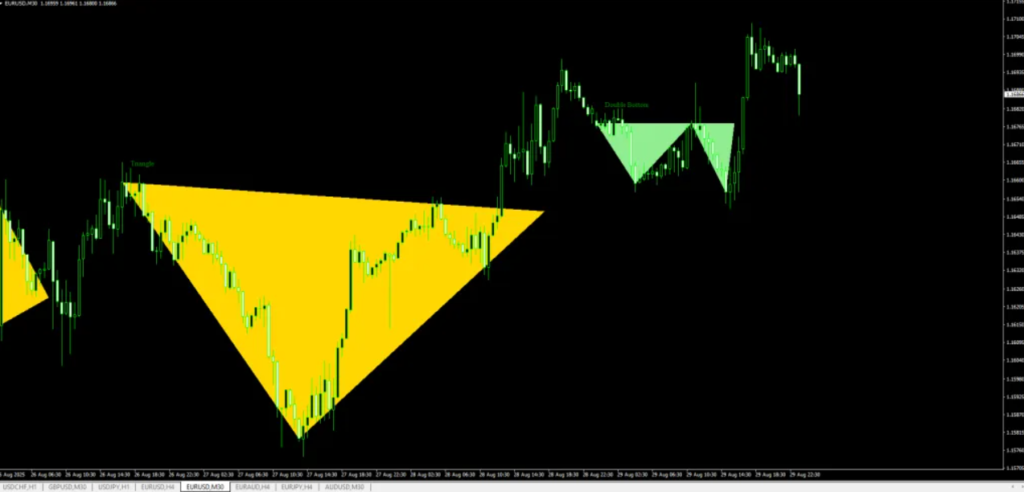
On a EURUSD M30 chart, the indicator highlighted a rising wedge (shaded green). This was a continuation pattern, and indeed, the price moved up higher right after. Later, it gave a head and shoulders pattern (shaded coral), which correctly signaled a bearish reversal. Traders who caught both signals had textbook entry and exit points without second-guessing.
How to Trade with the Market Structure Patterns Indicator
Here’s a straightforward approach:
- Wait for a pattern to form – The indicator shades and labels it automatically.
- Match the pattern type to your bias –
- Bullish reversal at support → look for long trades.
- Bearish reversal at resistance → prepare to short.
- Continuation patterns → add positions in the direction of the trend.
- Place stops smartly –
- Below the most recent swing low for buys.
- Above the most recent swing high for sells.
- For head & shoulders, put the stop above the “head.”
- Take profit – At the next support/resistance level or using a risk/reward ratio of at least 1:2.
Why Traders Love This Indicator
- Saves time – No more manually drawing and labeling patterns.
- Works on all pairs & timeframes – though it shines best on 4H, daily, and weekly charts.
- Perfect for price action traders – Patterns plus key zones = solid setups.
- Beginner-friendly – No need to memorize dozens of chart formations.
Whether you’re a scalper looking for quick setups or a swing trader waiting for bigger moves, this indicator helps you stay on top of market structure.